Just for exercise and fun I did this two interesting modules, available from the next JGrass release:
- r.cutout
- h.hypsographic
r.cutout
r.cutout allows the user to cut a map on the region defined by an other map that is considered as the MASK. There is also the option to invert the extraction and extract the output map as the complementary of the MASK map in the active region.
The usage is the following:
- standard mode: jgrass r.cutout --igrass-mask adigebz_nabla --igrass-tocut ad_pit4 --ograss-cut adigebzmask_pit
- invert mode: jgrass r.cutout --igrass-mask adigebz_nabla --igrass-tocut ad_pit4 --ograss-cut adigebzmask_pit --invert true
--igrass-mask: is the name of the input raster map containing the MASK -> the map that defines the region to cut out
--igrass-tocut: is the input map to cut out
--ograss-cut: is the output cut map over the defined region
--invert is the boolean that indicates the mode of calculation, default is FALSE -> standard mode, for the complementary map use TRUE
In term of pictures.
Starting from the two maps:
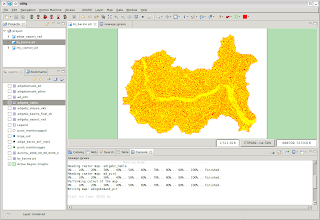
- the map of NABLA calculated on the extracted basin
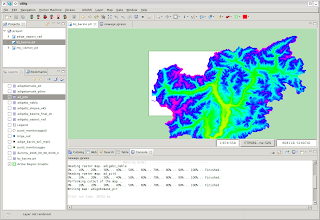
- the whole map of depitted elevations
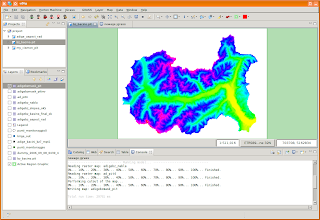
- obtain the map of depitted elevations on the extracted basin
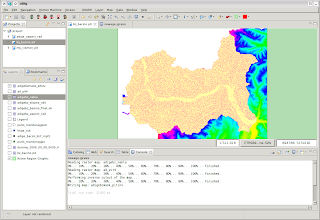
- obtain the map of depitted elevation on the extracted basin's complementary area in the active region
r.hypsographic
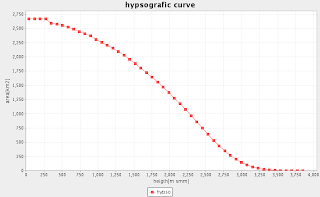
r.hypsographic allows the user to create the hypsographic curve of a map limited to the active region. The hypsographic curve is usually calculated starting from an elavation map and it is described by the cumulative height frequency curve for the Earth’s surface or some part thereof. A hypsometric curve is essentially a graph that shows the proportion of land area that exists at various elevations by plotting relative area against relative height (http://www.britannica.com/EBchecked/topic/280163/hypsometric-curve).
The usage is the following:
jgrass h.hypsographic --igrass-elevation bz_bacino.pit --bins 50 --ochart-hypsographic "LINE#hypsografic curve#heigth[m smm]#area[km2]#hypso"
where:
--igrass-elevation: is the name of the input raster map of elevation
--bins: is the number of bins in which divide the entire range of heigth of the raster map (default is 100)
--oscalar-hypsographic: is the output scalar set
--ochart-hypsographic: is a way to visualize the output scalar set in a chart
In the example below:
- the input elevation map on the basin

1 comment:
Very well done hydro-lady!!
Glad to see that you will start to contribute bunches of modules. Nice, nice!!
Post a Comment