Monday, October 12, 2009

Lentamente muore
chi diventa schiavo dell'abitudine,
ripetendo ogni giorno
gli stessi percorsi,
chi non cambia la marcia,
chi non rischia e cambia colore dei vestiti,
chi non parla a chi non conosce.

Muore lentamente
chi evita una passione,
chi preferisce il nero sul bianco
e i puntini sulle "i" piuttosto che
un insieme di emozioni,
proprio quelle che fanno brillare gli occhi,
quelle che fanno di uno sbadiglio un sorriso ,
quelle che fanno battere il cuore davanti all'errore e ai sentimenti.

Lentamente muore
chi non capovolge il tavolo,
chi è infelice sul lavoro
chi non rischia la certezza per l'incertezza
per inseguire un sogno,
chi non si permette almeno una volta nella vita di fuggire ai consigli
sensati.

Lentamente muore
chi non viaggia,
chi non legge,
chi non ascolta musica,
chi non trova grazia in se stesso.

Muore lentamente
chi distrugge l'amor proprio
chi non si lascia aiutare;
chi passa i giorni a lamentarsi della propria sfortuna
o della pioggia incessante.

Lentamente muore
chi abbandona un progetto prima di iniziarlo,
chi non fa domande sugli argomenti che non conosce,
chi non risponde quando gli chiedono qualcosa che conosce.

Evitiamo la morte a piccole dosi
ricordando sempre che essere vivo
richiede uno sforzo di gran lunga maggiore del semplice fatto di
respirare.

Soltanto l'ardente pazienza porterà al raggiungimento
di una splendida felicità

Pablo Neruda

Sunday, February 8, 2009

OpenOffice and Charts

Finally I got the way to save an OpenOffice Calc chart as an image... easy but not quick... Here a short description.

You can export charts using OpenOffice Draw.
  1. select the chart so it has green handles
  2. copy it
  3. paste it into Draw
  4. then while still selected do File -> Export and choose your favorite format
  5. take care of having the chart in the Draw page, all the region outside the Page will not be exported
Have fun with OpenOffice and Charts... :D

If you would like to save all the charts in a spreadsheet... so take a look at this link... here is a macro that does it.

http://www.oooforum.org/forum/viewtopic.phtml?t=60155&start=0&postdays=0&postorder=asc&highlight=&sid=bf3f571e41e622368b27df716d413d07

Geostatistic and JGrass


JGrass implements two basic geostatisics modules:
  • h.variogram
  • h.kriging
The two modules are correlated because the kriging algorithm needs an input variogram and the h.variogram allows the user to calculate the variogram of some measured data.

h.variogram
Output of this module is the experimental semivariogram for the data measured in the monitoring points.
The inputs are:
- feature of monitoring point
- the measured data
- the amplitude of distance classes
The syntax is the following:
jgrass { h.variogram --idfield "NETNUM" --iscalar-inputvalues "/Users/silli/rain_variogram" --iflayer-positions stazioni_rain_all --oscalar-cloud "CONSOLE" --distance 3000 }

and the output is the complete semivariogram for each timestep of rain data in the input values file. I think this is amazing becuase you can just collect some timestep values and with just a command create the semivariograms.
The output is a table with:
- distance
- semivariogram
- Moran index
- Geary index
for each timestep in the input file.

After having the experimental semivariogram it is possible to calculate the fitted one using a spreadsheet. After plotting the semivariogram points the parameters needed for the kriging module are:
  • nugget
  • sill
  • range
  • model type
The model type can be:
  1. spherical
  2. exponential
  3. gaussian
  4. sillian
And the other parameters are desumed from the semivariogram chart as explained in the following picture.

And the variogram's types are in the next picture.


h.kriging
This modules interpolate with the kriging algorithm a quantity in either specific points or over an area. The output of this module can be:
  • a value of the quantity for each input point feature
  • a raster with the quantity over the surface
jgrass {
h.kriging
--idfield "NETNUM"
--maxpoints 4 --minpoints 2 --model 1 --nugget 0
--sill 0.12 --range 25000 --dovariance "true" --searchradius 100000
--itscalar-inputvalues "/Users/silli/rain_2005.csv"
--iflayer-positions "stazioni_rain_all"
--iflayer-interpolatedpositions "bacini_bz_idlikedb0"
--oscalar-outputvalues "CONSOLE"
}

where:
  • idfield is the name of the field in the shapefiles with the idvalue, it has to have the same name for the measured position layer and for the interpolated position layer
  • itscalar-inputvalues: is the input file with the measured data in the monitoring points, this has to be in the form: a line for each timestep and for each line the monitoring point id and the mesured data, all separated by a space
  • iflayer-positions: is the layer with the monitoring points (feature's type: points)
  • iflayer-interpolatedpositions: is the layer with the outupt position (feature: points or polygons)
  • the output can be written in console or in a table or file as usual in JGrass

Wednesday, December 17, 2008

My first JGrass modules

Finally I decided to start to work in the new JGrass developing some hydrological modules (like I did in the JGrass2.0).
Just for exercise and fun I did this two interesting modules, available from the next JGrass release:
  • r.cutout
  • h.hypsographic
This two modules are developed, as all the others in JGrass, following the OpenMI guidelines.

r.cutout

r.cutout allows the user to cut a map on the region defined by an other map that is considered as the MASK. There is also the option to invert the extraction and extract the output map as the complementary of the MASK map in the active region.
The usage is the following:

  • standard mode: jgrass r.cutout --igrass-mask adigebz_nabla --igrass-tocut ad_pit4 --ograss-cut adigebzmask_pit
  • invert mode: jgrass r.cutout --igrass-mask adigebz_nabla --igrass-tocut ad_pit4 --ograss-cut adigebzmask_pit --invert true
where:

--igrass-mask: is the name of the input raster map containing the MASK -> the map that defines the region to cut out
--igrass-tocut: is the input map to cut out
--ograss-cut: is the output cut map over the defined region
--invert is the boolean that indicates the mode of calculation, default is FALSE -> standard mode, for the complementary map use TRUE

In term of pictures.
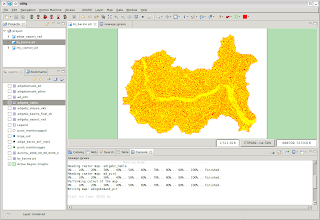
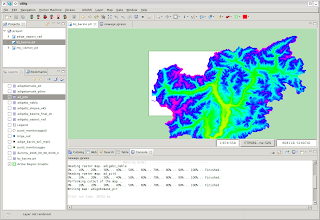
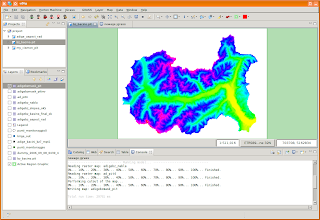
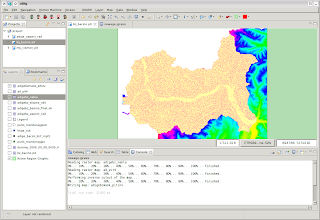
Starting from the two maps:
  • the map of NABLA calculated on the extracted basin
  • the whole map of depitted elevations
  • obtain the map of depitted elevations on the extracted basin
  • obtain the map of depitted elevation on the extracted basin's complementary area in the active region


r.hypsographic

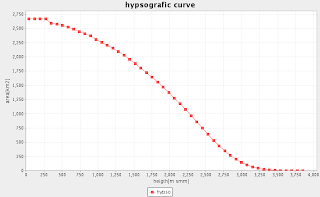
r.hypsographic allows the user to create the hypsographic curve of a map limited to the active region. The hypsographic curve is usually calculated starting from an elavation map and it is described by the cumulative height frequency curve for the Earth’s surface or some part thereof. A hypsometric curve is essentially a graph that shows the proportion of land area that exists at various elevations by plotting relative area against relative height (http://www.britannica.com/EBchecked/topic/280163/hypsometric-curve).
The usage is the following:
jgrass h.hypsographic --igrass-elevation bz_bacino.pit --bins 50 --ochart-hypsographic "LINE#hypsografic curve#heigth[m smm]#area[km2]#hypso"

where:

--igrass-elevation: is the name of the input raster map of elevation
--bins: is the number of bins in which divide the entire range of heigth of the raster map (default is 100)
--oscalar-hypsographic: is the output scalar set
--ochart-hypsographic: is a way to visualize the output scalar set in a chart

In the example below:
  • the input elevation map on the basin
  • the output hypsographic chart

Sunday, November 16, 2008

Flood expectancy

There is a part of a book I am reading in these days that I consider a part of my thought, since it is well written I decided to add to my blog... :-)

"There are hundreds of thousands of culverts and small bridges over which roads and highways span channel of various size. If the capacity of such culverts were too small and many of them washed out, the expense would be very great. But if overdesign were the rule, money for construction would be needlessly spent." ... "It has been decided that culverts constructed with federal money would be designed to carry without failure a flood discharge with a recurrence interval of 50 years. Such decision places an enormous buden on hydrologists. They must develop simple but dependable methods to estimate flood discharge in ungaged areas in diverse climates and topography and for various basin sizes."
...
"A different kind of social cost results from the fact that people use flood-prone areas. Despite their knowledge of the importance of flood estimates, individuals continue to build on floodplains, encroaching on parts of rivers needed to carry rather ordinary discharges. The floodplain level is equaled or exceeded about one a year. So despite the vast sums spet on controlling floods, flood damage continues to rise year after year and is measured in bilions of dollars. Per-capita flood damage increased two and a half times in the United States between 1916 and 1985."


We should think about this...

Tuesday, August 19, 2008

If you can't be a pine on the top of the hill
Be a scrub in the valley
but be the best little scrub by the side of the hill,
Be a bush
if you can't be a tree.
If you can't be a highway
just be a trail
If you can't be the sun
be a star;
It isn't by size that you win or fail...

Be the best of whatever you are.


Italian translation...

Se non puoi essere un pino sul monte,
sii una saggina nella valle,
ma sii la migliore piccola saggina sulla sponda del ruscello.
Se non puoi essere un albero,
sii un cespuglio.
Se non puoi essere un'autostrada
sii un sentiero.
Se non puoi essere il sole,
sii una stella.

Sii sempre il meglio di ciò che sei.

Martin Luther King

Friday, July 25, 2008

Back again after 3 moths...

I am back again with some JGrass tips.
Things have been really busy in this period, I think the only week I wasn't in office was the Hacking Event in Bolsena, thanks to all partecipant for the nice days.

Regarding the JGrass staff, yeah we are working on it, and we are planning to finish all the porting from the old JGrass2.0 to the new JGrass uDig plugin. So during the next month I will write some documentation (here or in the wiki) on JGrass main stuffs. The month before FOSS4G is financed by HydroloGIS and CUDAM to set up all the needed user documentation and to fix some of the known (and unknown but coming) JGrass bugs/problems/not so usable things.

If you use JGrass and have some interesting comments, please leave your comment here or use the JGrass wiki page to directly interact with our staff.
All the problems and bug reports are very wellcome.